Market Influence Graph
Interactive supply chain influence visualization that discovers which companies' stock prices can predict others through Granger causality analysis.
Overview
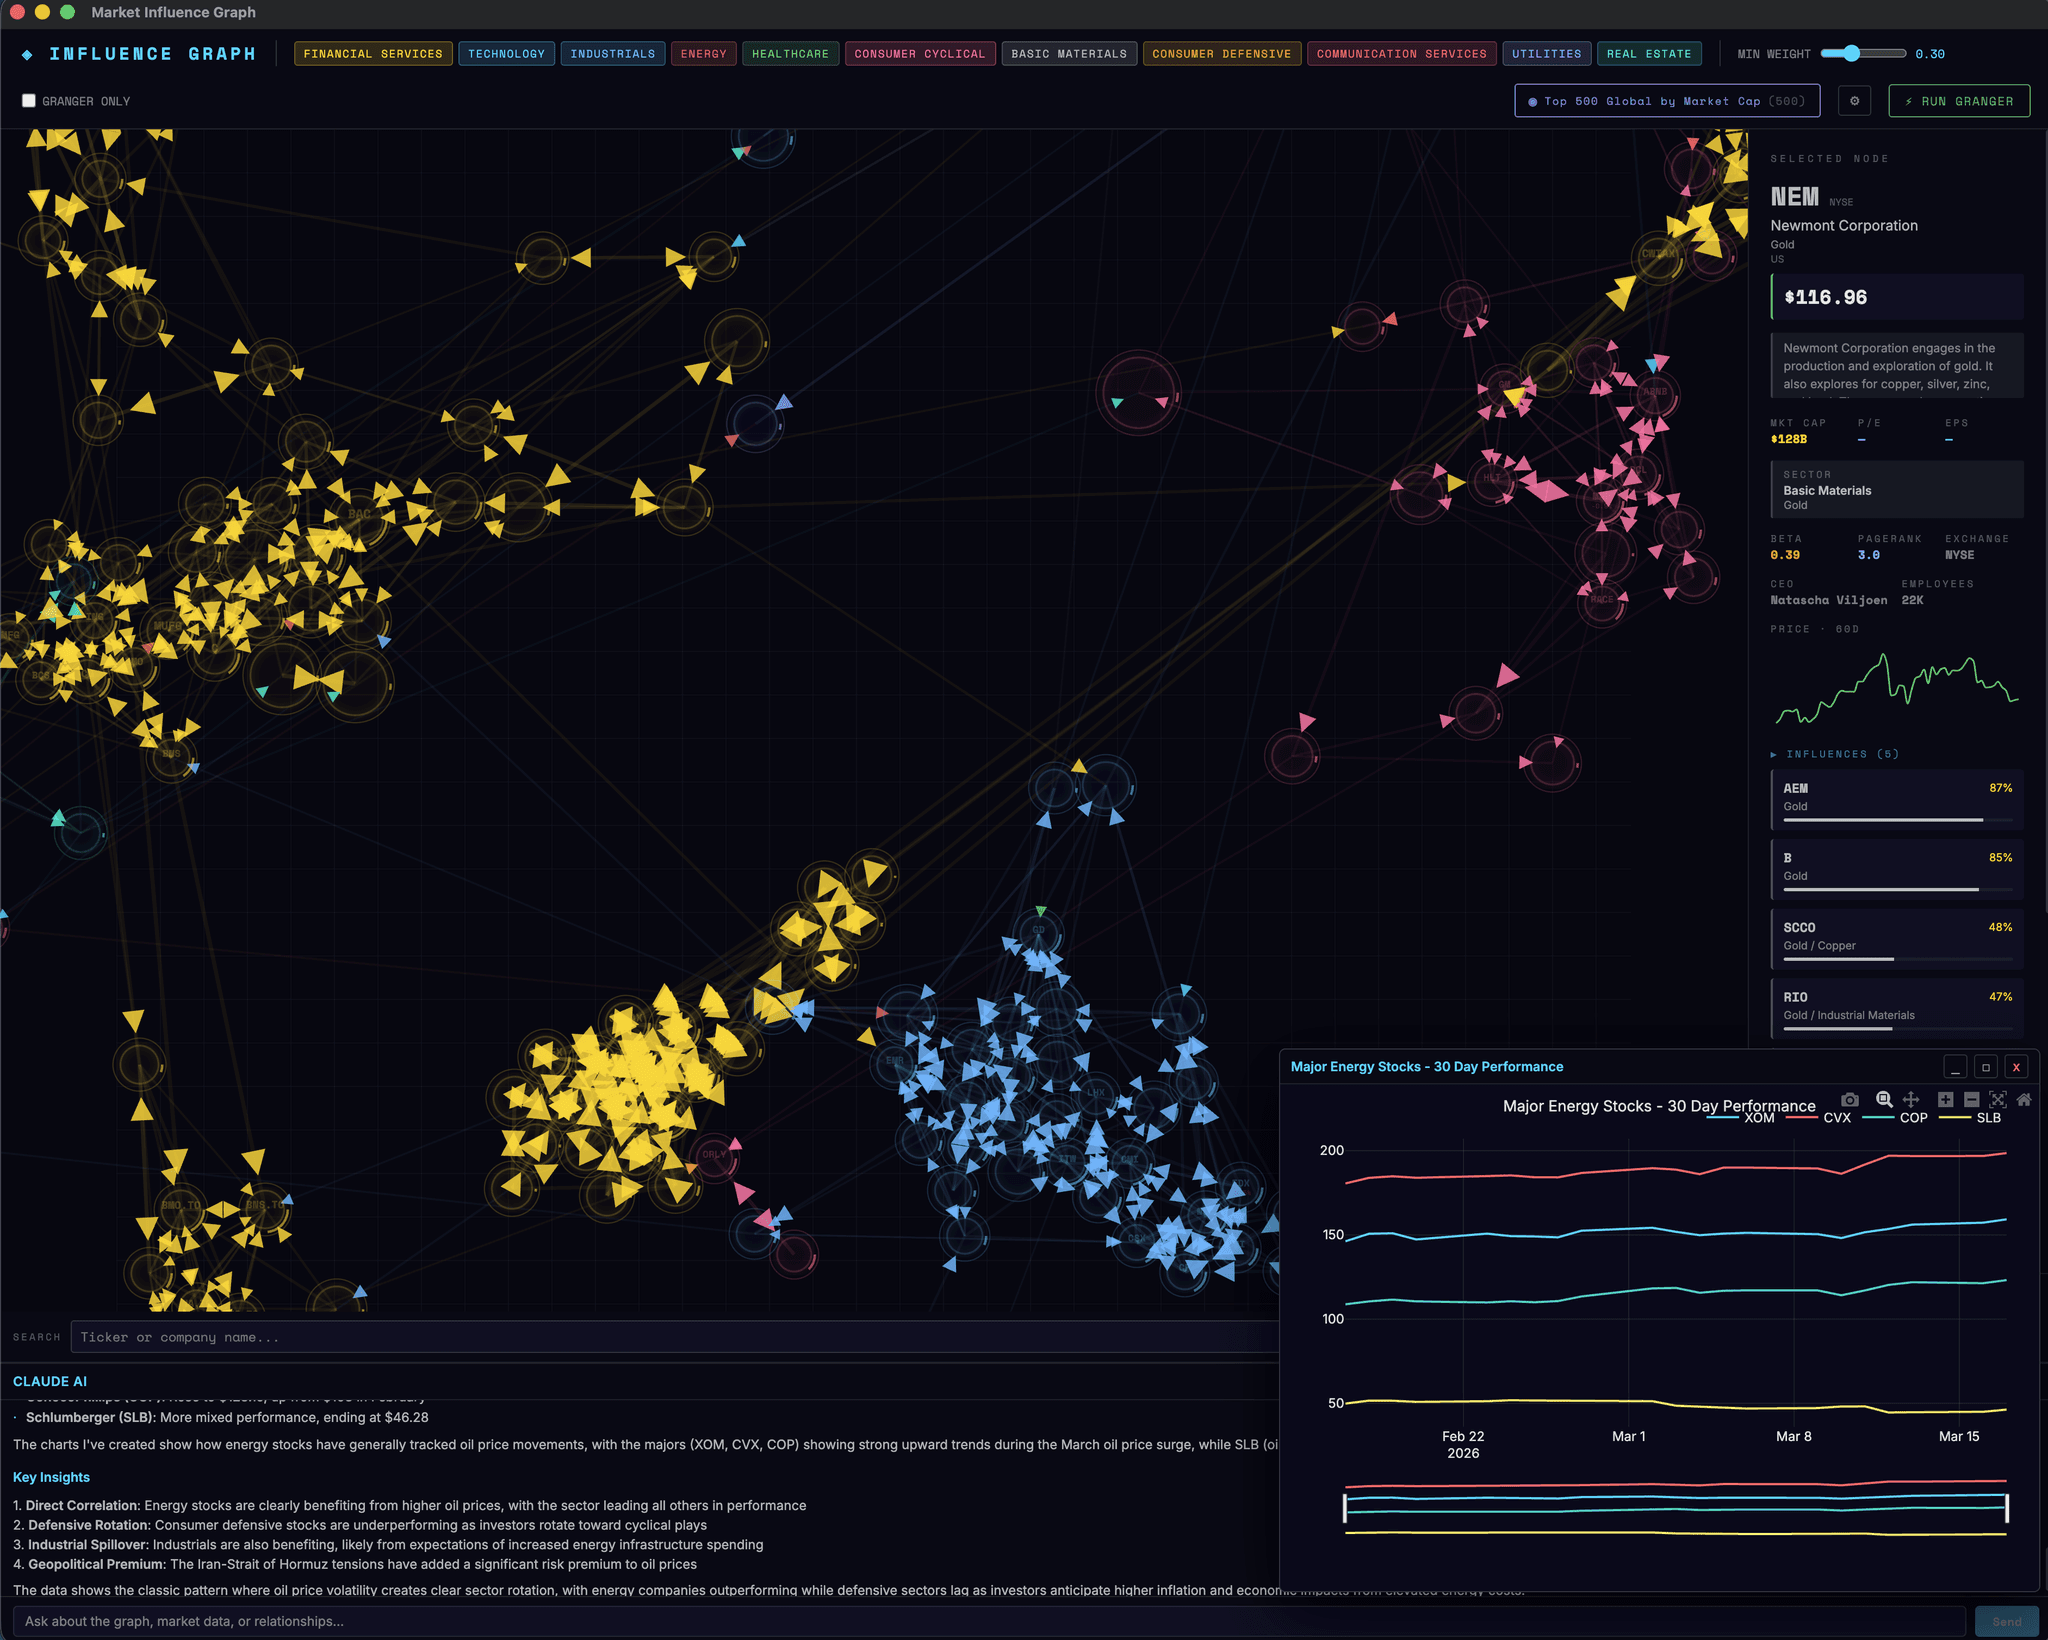
Market Influence Graph is an interactive supply chain visualization that models predictive relationships between publicly traded companies. The core thesis is that supplier stock prices are leading indicators for customer stock prices — purchase orders are placed in advance of earnings, creating measurable lead-lag relationships. The application maps ~500 major companies, discovers ~3,600 supply chain relationships from SEC filings and peer data, then validates them with Granger causality testing to surface which relationships have genuine predictive power.
The result is a force-directed graph where you can explore how market influence propagates through supply chains, drill into individual companies with live market data, and query the entire system through an AI chat assistant with 24 specialized tools.
Architecture
The backend is a FastAPI application with 94 REST endpoints across 8 route groups (graph, prices, signals, chat, screens, settings, institutional, financials). The graph engine uses NetworkX for centrality metrics (PageRank, betweenness), and statsmodels for Granger causality testing with configurable lag windows up to 30 days.
The frontend is React 18 + Vite with a D3 v7 force-directed graph as the primary visualization. Live market data refreshes every 60 seconds via batch FMP API calls without restarting the D3 simulation — prices and metrics are applied in-place through D3 selection mutations. Interactive Plotly charts render in draggable floating windows via react-rnd and React portals.
The app also runs as an Electron desktop application, with the Python backend launched as a managed child process.
Key Features
Three-Tier Relationship Discovery
Edges are discovered through a prioritized pipeline: Tier 1 parses SEC 10-K/8-K filings for “significant customer” and “major supplier” disclosures. Tier 2 pulls cross-sector peer relationships from FMP’s stock peers API. Tier 3 groups companies by GICS sub-industry. A two-phase startup shows sub-sector edges instantly while the full SEC + peer discovery runs in the background.
Granger Causality Validation
Each discovered relationship is statistically tested: does Company A’s historical returns improve prediction of Company B’s future returns? The system tests lags from 1–30 days to find the optimal lead-lag period, with p-value < 0.05 confirming statistical significance. Edge weights blend base correlation (60%) with Granger statistics (40%), and unvalidated edges are deprioritized.
Custom Graph Universes
Replace the default S&P 500 universe with any filter combination — market cap, country, exchange, sector, beta, dividend yield, volume, price. Four built-in presets (S&P 500, Top 500 Global, Top 500 US, Mega Cap >$200B) plus user-created custom screens, each with isolated per-screen caching for instant switching.
AI Chat with 24 Tools
A Claude-powered chat assistant can query graph structure, fetch live market data, analyze relationships, run Tavily web research, and generate 16 types of interactive Plotly charts (line, bar, heatmap, scatter, violin, seasonality, 3D surface, and more) — all rendered in draggable floating windows.
Live Market Data
Real-time prices, daily change, market caps, P/E, EPS, beta, and company profiles via FMP as the primary data source with yfinance as automatic fallback. Quotes are cached for 15 minutes, company profiles for 30 days. Node sizes in the graph scale by market cap, colored by sector.
Centralized Configuration
100+ configurable values across 14 categories — cache TTLs, AI model selection, Granger parameters, D3 force physics, polling intervals, Electron window dimensions — all editable in-app through a settings panel. The backend settings service is thread-safe with dot-path access.
Design Decisions
Two-phase startup ensures the graph is interactive within seconds. Quick sub-sector edges (no API calls needed) render immediately, while the computationally expensive SEC filing parsing and peer discovery runs in a ThreadPoolExecutor background. Users see a useful graph right away that progressively enriches.
Per-screen caching isolates each universe’s data (companies, relationships, graph state) in its own cache directory. This lets users switch between S&P 500 and a custom Mega Cap screen without re-running discovery, and prevents cache collisions between different company sets.
Stable graph updates separate structural changes from data refreshes. The 60-second live data poll updates node attributes in-place via D3 selections without restarting the force simulation, so the graph layout stays stable while prices and metrics stay current.
Edge weight blending combines a base weight (from correlation or sub-sector proximity) with Granger validation statistics, ensuring that statistically validated relationships are visually and analytically prioritized over heuristic ones.
Tech Stack
- Backend: Python 3.11+, FastAPI, NetworkX, statsmodels, pandas, numpy
- Frontend: React 18, Vite, D3 v7, Plotly.js, TailwindCSS, react-rnd
- Data Sources: FMP (45+ endpoints), yfinance (fallback), SEC EDGAR
- AI: Anthropic Claude SDK (24 tools), Tavily (web research)
- Desktop: Electron 40
- Analysis: Granger causality, PageRank, betweenness centrality, BFS signal propagation